Wednesday, November 29, 2006

Breakdowns


I'm going to focus on one of the most easily identifiable patterns found daily throughout the stock universe. The Opening Range Breakdown. Another term I'm going to address is the Secondary Trendline. After confirming a breakdown, you also want to check if there is the break of the secondary trendline as annotated. Generally, when the Secondary, or steeper, trendline is violated, the odds greatly increase that the stock or index will continue to fall to the primary (flatter) trendline.I use my Scottrade Elite Platform to run Trade-Ideas Stock Scanner, and one of them is the opening range breakdown, with other minor requirements such as avg. daily volume 500k shares, price above $10, etc.

Today's Trades:

Advanced Auto Parts (AAP..not ipod)


Apple Computer (AAPL)


Another View of the Apple Trade:

Good Morning

News UpDate
09:00am ET Dow , Nasdaq , S&P : [BRIEFING.COM] S&P futures vs fair value: +4.4. Nasdaq futures vs fair value: +7.0. The stage remains set for the cash market to open on an upbeat note as investors continue to rally around evidence that the economy is not slowing as much as expected. Throw in an analyst upgrade on Dow component Verizon Communications (VZ) and Bear Stearns raising their price target on tech bellwether Apple Computer (AAPL) to $100 from $94 and it appears buyers will pick up where they left off a day earlier recouping more of Monday's sell-off. Nasdaq at... NYSE Adv/Dec 0/0... Nasdaq Adv/Dec 0/0.

Stickin' to my Guns, or Shorts..


Look, I'm not a bear here, nor am I implying that the whole market is still going to sell off, I am sticking to my shorts that I've put in based on technical indicators. They both struck me as nice short positions with a fairly decent risk to reward ratio. The market was weak early in the day but did manage to eek out into the green. I can't believe how strong Apple Computer is holding. The stock seems to be ironclad and barely got it's feet wet when the NASDAQ sold off over 50+ points on Monday, November 27, 2006.

I'll be keeping an eye out on market sentiment, because the direction going into December is anyone's guess. Will the foreshadowed "Santa Clause" rally come out of the sleigh?


High five to Will over at DummySpots for posting a great article on how tech stocks, also the QQQQ, are tied to the high fliers such as Cisco (CSCO) and how it tends to be a market leader. Nice work, I enjoyed the article.

Tuesday, November 28, 2006

NYC


Run like hell
Originally uploaded by Thorbion.
city lights

Big Apple


Big Apple
Originally uploaded by singstar85.
big apple

Monday, November 27, 2006

The Down Jones!


Just as I expected, I made a call to myself that we would sell off this week, but I was prepared this time and had the short ideas ready for action! Now there are lots of types of sells offs. We do have a weaker dollar, and of course the weak Wal-Mart Store sales have been highlighted, but as President Bush's words would say, "This market is strong, and we intend to keep it strong" (appears redundantly on CNBC). I believe this to just be some profit taking, we've had our run up, the bulls conquered, the bears covered, now I expect the Put/Call Ratio to liven up quite a bit, and also the VIX should get shaken up from it's complacency. People will be thinking we're headed lower, but with over $9 BILLION DOLLARS$ spent on Black Friday, I am staying alert for reversals. I'm looking for retailers, tech, and some oil to play on, as they should all tread higher after a nice pullback, and maybe a brief consolidation period. Here were my short ideas coming into the day!

SunPower Corporation (SPWR)
Here, I'm going to highlight a technical candlestick pattern which I've head great success with, called Bearish Harami Patterns, and SunPower fit the criteria Perfectly!! The key to a higher risk/reward ratio is to short the stock on or near key levels of resistance.

Description of Bearish Harami Patterns:
1.) The market, or stock's chart, is characterized by an uptrend.
2.) A 2 candlestick pattern in which a long white candle on the first day, is proceeded by a black candle whose real body is completely engulfed by the real body of the first day's white candle.

What it Means:
1.) A sign of disparity about the market (or stock's) health.
2.) A small black candle shows some uncertainty.
3.) A change of the trend.

I will remain short both of these stocks until I see it necessary to cover from a reversal in the current market sell-off.


Electronic Arts Inc. (ERTS)


Also check out a great blogger and market analyst's Steve Puri's Market Opinion.

Sunday, November 26, 2006

Anticipation


Dear Readers,
I just wanted to point out that there is possibly a new Financial/Investment/Stock Trading series in the works. If you haven't heard yet, the producers of the popular "Entourage" HBO show are looking to create a show that deals more with young Wall Street investors making $40-$60 million dollars a year. Great Idea! as this would be the ideal time to release a show with the market at it's all time highs. There is currently a show called, "Wall Street Warriors" but is only available on HDTV's Mojo, channel (paid subscription). However, if you'd like, you can check out, (4TV) for a free glimpse of the weekly show, under HDTV Channel 1, Sunday's at 10pm. This new show will re-enact some real-life trading situations with a comical twist. I am very excited to see such a show, as a trader I'm always thrilled to get into the life of another highly successful trader, so see how they work, operate, and daily routines. Aren't you?

Thursday, November 23, 2006

Well here ya go!


You know what this is about.

No Day-Trading for me Today, I took the day off.

It's cool though, because my long term investments were up $800 today, so I still had a smile on my face at the end of the day. Especially after that ECarFly (ECFL) run, up 310% today, sheesh.

Tuesday, November 21, 2006

Trade Idea Executed!


Reliance Steel (RS), gapped up this morning in PRE-MARKET, on strong volume. I was watching pre-market, and entered a limit order of $36.01. I saw the stock having strong volume, 200% increase compared to the typical volume, which is a good sign. My target of $38 was hit 4 bars later, AFTER THE OPEN, on a 15 min timeframe.

I ran a stock scan on Stock Charts this morning around 2:30am as I could not sleep and I found this under CCI Buy Signals. Check my previous blog entry for the full trade-idea analysis.

The trade netted 1.99 points.
Shares: 500
Gross Profit: $995.00

Another Trade Idea! (Longer Term View)
If you had to pick 3 companies to invest in over the next 10 years and not touch the investment throughout the duration, which would they be?

Here's mine: Google (GOOG), Apple Computer (AAPL), and Starbucks (SBUX)
The growth potential for these companies are outstanding, and I don't see these stocks as being trendy, as demand will/should only increase.

Let's take a look at one of the aforementioned stocks...

Starbucks (SBUX)


Trade Ideas!


Let's take a look at Reliance Steel (RS). It's been a nice uptrend, support from strength in the metals sector, PD Acquisition initiating strong attraction to these stocks, near-term resistance just overhead. If RS can break through this price point of $35.99 on strong/better than avg. volume, then it's definitely a buy, as the momentum will be carrying it higher. Possible near-term target $38.


Here is BankFinancial Corporation (BFIN). It's RSI is declining, printing lower low's, broke it's 50DMA, lower high's on the MACD. If it breaks through $17.49 on decent volume, throw in a short, as the momentum will be in a downward spiral, possible near-term target $17.20. If the $17.50 level holds, do not short this stock.

Disclaimer: I am not a CFA, and take no responsibility with what you do on account of this information.

Monday, November 20, 2006

Boring Day, Small Scratch


Wow, my first losing day in weeks! It's okay I'm not worried as I implemented strong money management today, and risk control. Stop Limit Orders are great when you've draw your trendlines, taken an overall glimpse of the market, and made the decision to pull the trigger. I personally like stop loss orders, as many oppose them, but they can be fairly reliable in a sideways market, and should not be used on Momentum plays, where a stock fluctuates $1.00-$2.00 every hour, it will blow right through your order.

Anyway, I took a scratch of a $200 Loss today.

Hope you did well out there. Remember the name of the game is "Capital Preservation" not "Day-trade your Life Savings Away."

Calculate your risk, and pull the trigger.
Out,
CalTrader

Friday, November 17, 2006

NYMEX's Gift To Me

Scalp Tale of The Year!

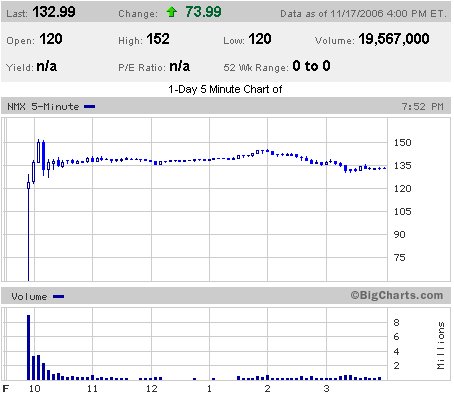
Today was the IPO (Initial Public Offering) of the NYMEX (NMX).
I anxiously awaited the first trade to made by Chairman Richard Schaeffer, and I was already astonished by the 120% jump in the $59 offering price to $120 per share, I still knew there was room to fly up, as this may have been one of the most anticipated IPO's of the year, and it just so happened to be when the market is at it's all time HIGH!

It's around 9:45ish and the first trade was made....the stock is flying through the roof....I go to my order entry screen and punch in a 400 share lot, Market order.

Boom, I'm filled within seconds, share price $122.48!


Two minutes later the stock is near $138.25, I'm up over 10 points!!!! My nerves are jumping, my eyes looking all over the screen to make sure this is real, I've never experienced anything like this in the world!

Do I sell now, or get greedy? This question boggled my mind for seconds, with the stock still flying up a point per second, I look again, and the stock is at $149.88 per share, I quickly enter in a MARKET SELL ORDER, and I was filled fairly quickly.

Are you ready for this??

Stock: New York Mercantile Exchange (NMX)
Entry Price: $122.48
Exit Price: $149.93
Share Size: 400
Gross Profit: $10,980.00 !!!

This day is my day that will go down in history not only with me but in the world. Nymex surpassed the top two U.S.-based IPO's for the past six years, with it's one day percentage gain of over 125%.


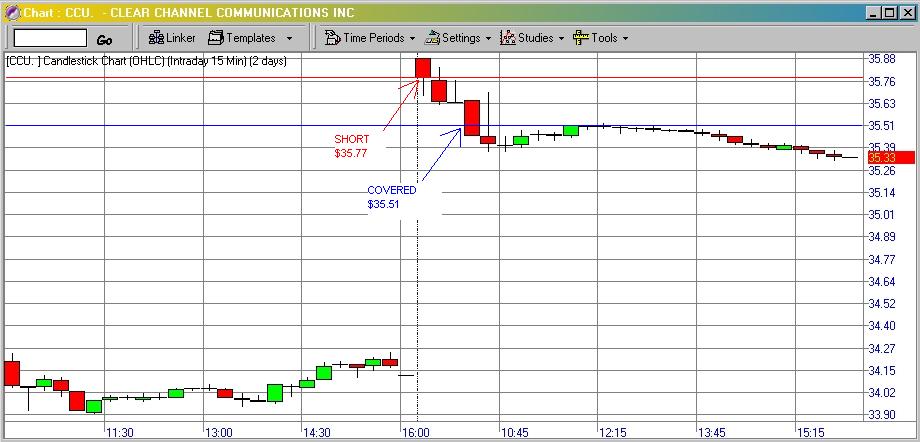
I did enter another order for this stock and unfortunately it lost $5,430.45. This was to be expected as the stock peaked around $150 and some change, and decended from there on out. If anyone was Brave enough to short sell near the top, they would've made a hefty profit as well, but I highly doubt anyone had the balls to do so.

I'll take it:
Trades Made Today: 2
Net Profit: $5,549.55

Out,
CalTrader

Thursday, November 16, 2006

Today's Action..


Today was a fight. A big fight actually. I fought the hard battle for every dollar earned.

I started the day off terribly, getting killed by a trade in Rambus Inc. (RMBS). The trade lost $1,350 in less than 5 minutes. Whew, yea you bet your buckle I was pissed. Most people don't make that much in a day, and I lost it.

Well off to the more positive news, of being a dedicated, knowledgable, and disiplined trader. I dug myself out of this hole, and quite well may I add.

Gross Profit: $2,845.87
Net Profit: $1,558.87
Trades: 20

Not too shabby considering I was in awe of my horrible decision to trade such a volatile stock that in my terms should be labeled, "No Mans Land".

So here's a good short I threw in today on SanDisk Corporation (SNDK). I saw a nice long candle on the opening bar, hitting yesterdays high to the cent and decending all the way to the bottom of it's range, almost breaking the opening range low. When I saw the break of the opening range low, I went short ($47.10). This stock was incredibly weak thereafter and made a nice free-fall for some good profit.


Another nice short today was Encore Wire Corporation (WIRE). It took out it's opening range low (opening range breakdown), busted through it's lower Bollinger Band, cleanly broke it's trendline, while tearing through it's 50% Fib retracement level, so I got short. *Notice* I covered my position at the 50% Fib Extension. Net points 0.47 (lotta technical indicators huh?) Click each for info!


Here is a cleaner chart for the more simplistic view of the trade, and how it ended throughout the rest of the day.


Clear Channel Communications, Inc. (CCU) was a GAP play that slowly tapered off it's high, I wanted a piece of that pullback, so I got short, again.

Total Profits


Today was relatively flat for me. Took some shorts, and some longs.

Gross Profit: $435.00

Not any in depth post, but more will come tommorow..

-Cal

Tuesday, November 14, 2006

Worked my ass off Today!


Okay, not enough sleep and traded all day.

Gross Profit: $981.00

I'll be posting charts, ideas, and my daily review later tonight
Over & Out,
CalTrader

Monday, November 13, 2006

Freshly Scanned Trade Ideas!


Today I surfed some good trades in oil. I usually watch oil prices on CNBC flip back and forth, but that became annoying.
My remedy: Chicago Mercantile Exchange Real Time Crude Oil Quote.

Today's trades included: Peabody Energy Corp. (BTU), Transocean Inc. (RIG), Joy Global Inc. (JOYG), and Level 3 Communications, Inc. (LVLT).

Nothing spectacular, just quick scalps really.
Trades: 12
Shares: 50,000
Gross Profit: $698.30

Today was probably the easiest money I've made, I mean I studied my setups, drew trendlines, watched the MACD for signals on a 30 minute chart, for an 8-day period. The signals are clear as day! I'll show one example. I spent around 2 or so hours at the computer. I went to my college courses, came back, put in my orders, and stops, took a shower, ate lunch, watched the daily market news and as you can see it performed nicely for me.

Peabody Energy Corp. (BTU)


Now after the MACD (Moving Average Convergence Divergence) signaled my buy, I scalped for $0.20 cents, 2 times, on 1000, and 1,400 share lots. As you can see from the chart the MACD never crossed back over signaling a sell point. I however did not want to participate in the volatile fluctuations of the Crude Oil Market today, so I played it safe.

Now for some good Ideas on Swing Plays that could possibly profit nicely.

Best Buy Co., Inc. (BBY) (Possibly a Near-Term Buy)


Wm. Wrigley Jr. Company (WWY) (Possible short canidate)


Disclaimer
: I am not a CFA, or stock broker and take no responsibility in the choices you make from the recommendations from this website. Use information accordingly under preferable market conditions to avoid substantial losses.

Friday, November 10, 2006

Update!

Okay so we did get quite the pullback after yesterday's afternoon session, and boy did I miss my mark on some damn good trades ON THE WEAKNESS!

I did have an early morning scalp on one of my favorite energy stocks: Peabody Energy Corp. (BTU). Oil was getting a nice pop in price and of course all the oils were treading higher. The trade netted $0.30 cents and the share size was 1,000 shares.

I was spooked out of the trade after the economic data was released that trade balance was lower than consensus and their was an immediate drop in the DOW. You can see the slight drop after the sell of the trade (where the red line is).

Gross Profit
: $300


On to business: Amazon.com (AMZN)
After reporting earnings CSCO popped up nicely hinting for a higher open of the NASDAQ on yesterday's opening, which ultimately leads to higher tech stock prices. AMAZON, however, was exceptionally weak, and I was trying to cash in. I missed my mark.

1. Sold Short: $39.51
2. Initial Stop: $39.59
3. Stopped Out: $39.59
Risk: $0.09 cents
Share Size: 2300

Gross Loss: $207

*If closed at the end of the day the trade would have netted:
P/L: $1,748.00!
Gain: $0.76 cents
12:1 risk/reward (12R for you homegamers!)


Let's not even talk about the Akamai (AKAM) trade that I missed.
4 Points!
HighChartPatterns, also pointed out in his nightly newsletter, he was 1 hair short of pulling the trigger as well. Those guys are some of the most uniformed traders there are. Great stock analysis, overall awareness of market conditions with multiple guys monitoring sectors at any given point during the day. Check them out!
Yours Truly,
CalTrader

Thursday, November 09, 2006

Whew! White Hot!

Last time I checked Apple Computer Inc. (APPL) was trading around $84.50! Sheesh! Since it's low of $50.16 it tagged on July 17th, 2006, it's come along way! Keep your eyes out on this stock, now that it's popped up over it's near-term overhead resistance, it may pull back a bit but the momentum behind this stock is full steam ahead for that 52 week high of $86.40.

Tuesday, November 07, 2006

Betting or Trading?


Your Trading Style Poll!

I recently came across an interesting conversation on EliteTrader.
The thread was Traders Make Money.

The interesting topic was if you're 95% sure of a trade in your favor, why not bet 95% of your portfolio's value?

Many combatting topic's arose such as: young traders can afford risk, experienced traders called it suicide, immoral traders said insider trading is good, define "killing in the market", name of the game is "capital conservation", going "All-In" works every single time but once, etc.

One trader noted that large gains can be made without using leverage:

"Catch a 2.00 move in soybeans with 2 contracts and thats $20k. Learn to take 30 ticks/week on zb. $8k/month on 2 contracts. etc. etc.. add these up and you'll be able to increase your size without overleveraging before you know it."

He stated that you don't have to risk 95% all the time, you just need great trading skills, analytical expertise, and specialize in an area of the market in which you've found an edge, and with that you can make a small forture without the desperate bets.
Good Thinking!

Today's P/L = $731.70
AKAM & BTU are some of my regular intra-day scalps as they fluctuate anywhere from 3-5% per day from low to high.

No Trades Today


No trades, waiting to see what elections do, and how the market will show it's colors.

Stay tuned, I'm ready for trading action!

Out,
Caltrader!

Thursday, November 02, 2006

Day Trade Day # 2

Ever feel like you trade sloppy? Patience, diligence, and researching good setups will get you to where you need to be.


Another huge day in the market! I scrambled all morning on losing trades that reversed on me because the market was so choppy. The indexes were playing tag with being in the green and the red, and finished negative in the red. I did manage to beat yesterday's net total, for my largest net gain in 1 day. I'm really starting to enjoy these wonderful positive days. My best money maker was Level 3 (LVLT).

Net P/L Total: $3,250

Sold Short
Covered


Bought
Sold

Wednesday, November 01, 2006

Done for the Day

Today was an uneventful day in the market for me, and I traded very well. I don't know what came over me, trades just came to me and I traded with confidence. Took some decent short setups in the oil sector today as they were all very weak. Also did some heavy scalping which became very profitable.

Total Net P/L : $2,484.65 (commissions included)

Some points of interest are the stock (LVLT) is traded very thickly with the avg trade size being near 50,000 shares. I got in and out all day long on 12,500 share lots scalping pennies. I usually am not a scalper but it was working, and hey if something is working and is profitable, why stop? I mean the commissions add up a little, but nothing too major for 1 day out of the week.

More trades coming,
-Caltrader